
One can be forgiven for taking mean average precision (MAP) to literally mean the average of precisions. Nevertheless, you couldn’t be further from the truth!
Let me explain.
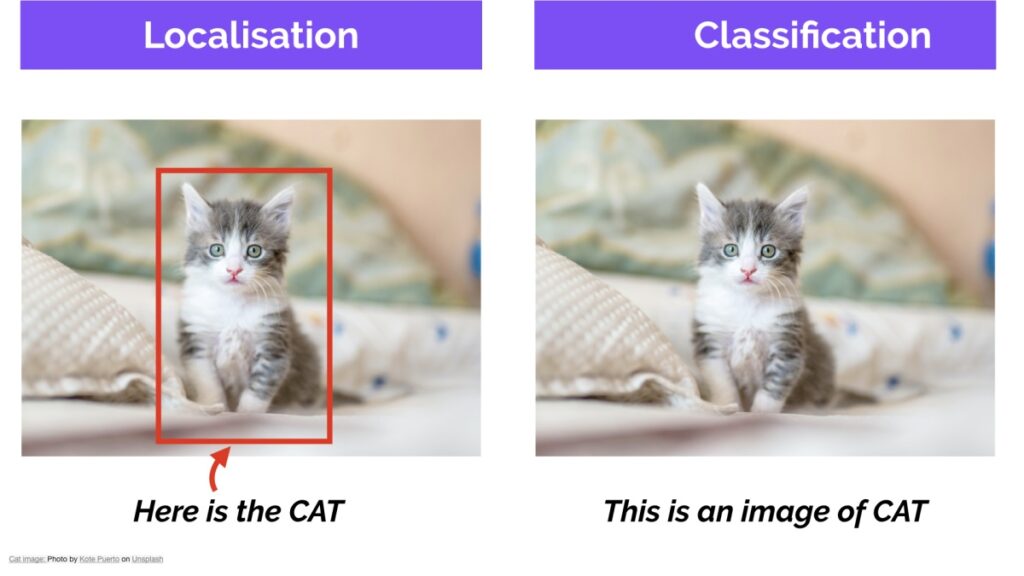
In computer vision, MAP is a popular evaluation metric used for object detection (i.e. localization and classification). Localization determines the location of an instance (e.g. bounding box coordinates) and classification tells you what it is (e.g. a dog or cat).
Many object detection algorithms, such as Faster R-CNN, MobileNet SSD, and YOLO, use MAP to evaluate their models for publishing their research.
You might ask, if it’s such a popular metric, why is it still confusing?
Fair enough!
How Does Mean Average Precision Work?
MAP stands for mean average precision (as you might already have guessed).
You might think it is the average of the Precision.
If you do not know already:
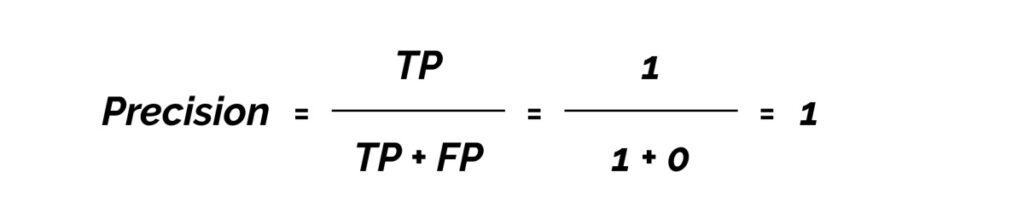
Precision measures how accurate your predictions are. i.e. the percentage of your predictions that are correct.
It measures how many of the predictions that your model made were actually correct.

TP = true positives (predicted as positive and was found to be correct)
FP = false positives (predicted as positive but was found to be incorrect)
Now, let’s calculate the MAP for the following image.
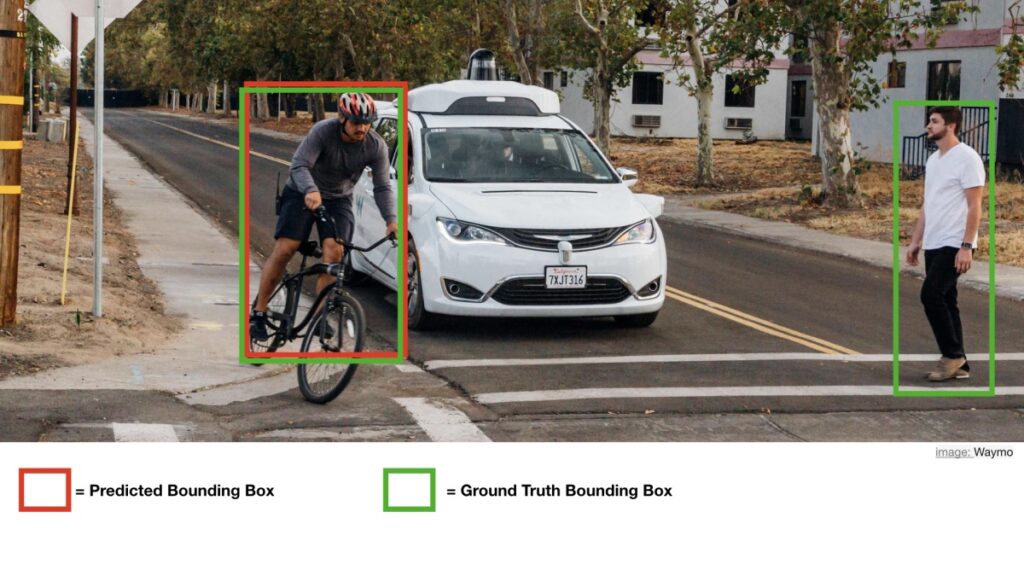
This is an object detection example for advanced driver-assistance systems (ADAS) and from the image, we get:
True Positives (TP) = 1
False Positives (FP) = 0

Because we only have one value, the average of precision will be 1.
Looking at the MAP score, you might end up using this model in your application. That would be a disaster.
AND THAT’S THE CATCH! DON’T LET THE TERM MISLEAD YOU.
MAP is not calculated by taking the average of the precision values.
Calculating Precision and Recall
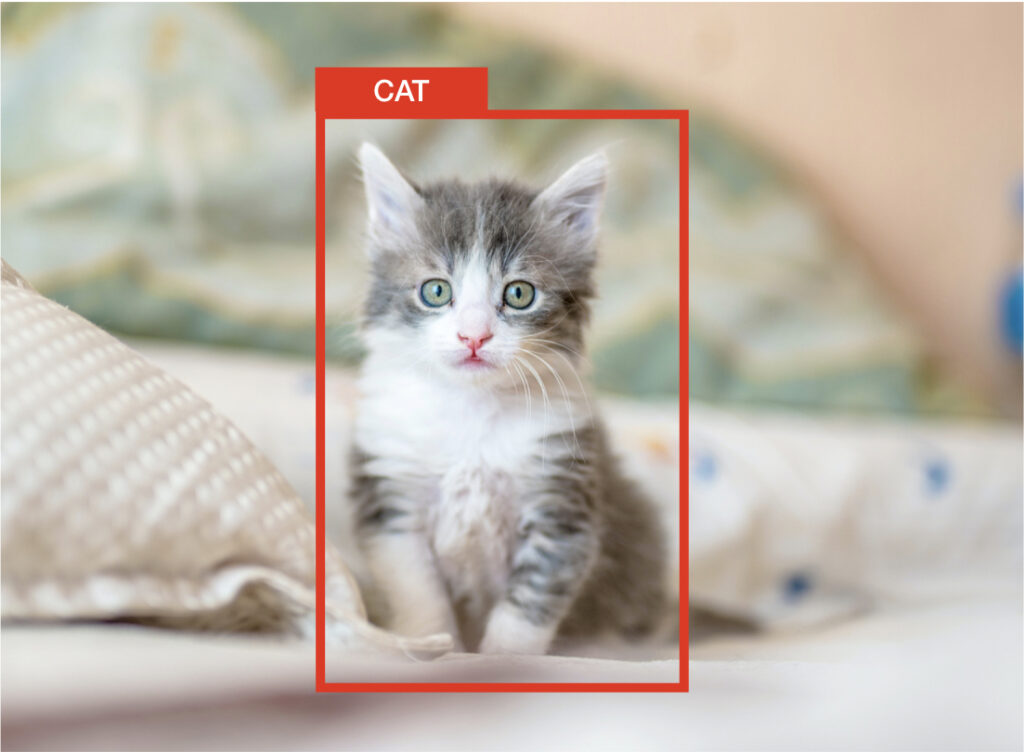
Object detection systems make predictions in terms of a bounding box and a class label.
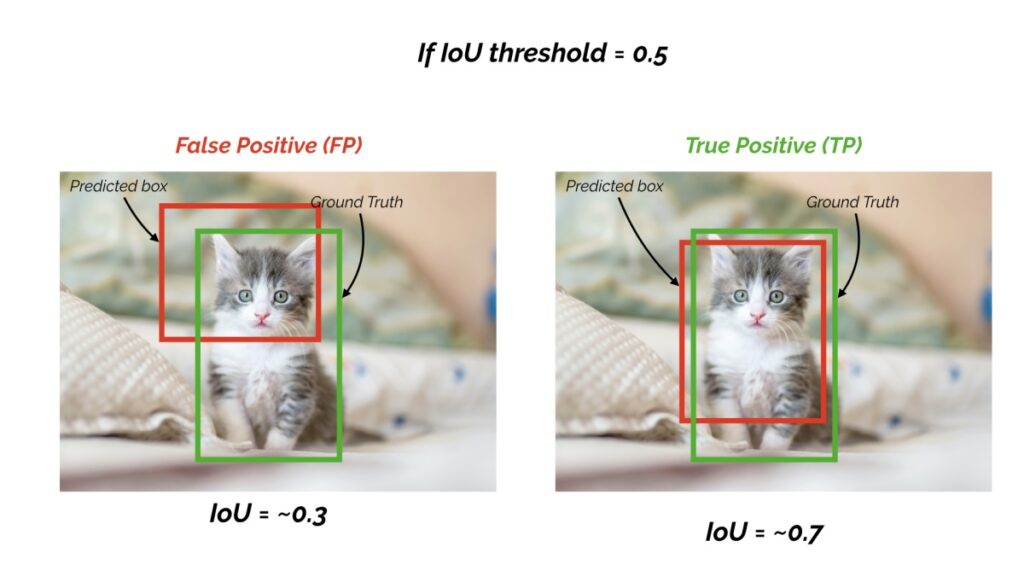
For each bounding box, we measure overlap between the predicted bounding box and the ground truth bounding box. This is measured by intersection over union (IoU).
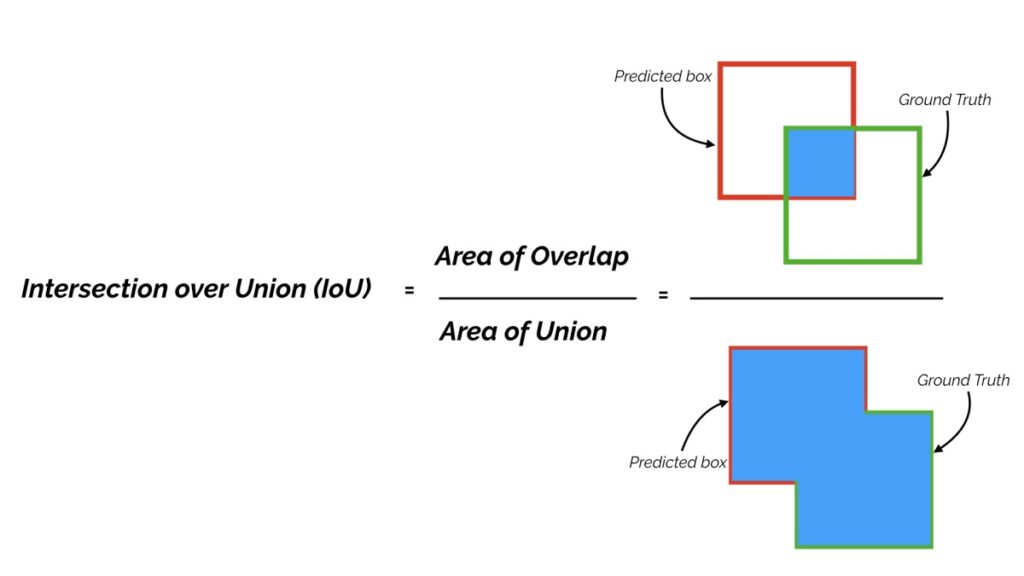
For object detection tasks, we calculate precision and recall using the IoU value for a given IoU threshold.
For example, if the IoU threshold is 0.5, and the IoU value for a prediction is 0.7, then we classify the prediction as true positive (TP). On the other hand, if the IoU is 0.3, we classify it as False Positive (FP).
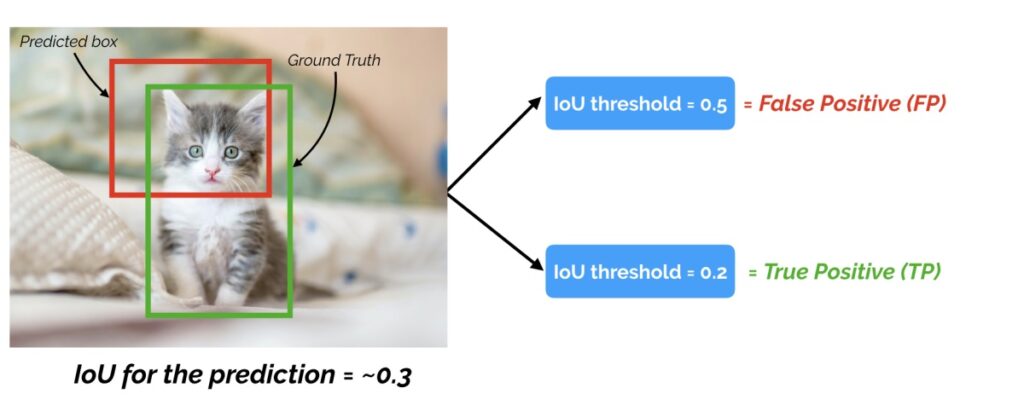
That also means that for a prediction, we may get different binary TRUE or FALSE positives, by changing the IoU threshold.
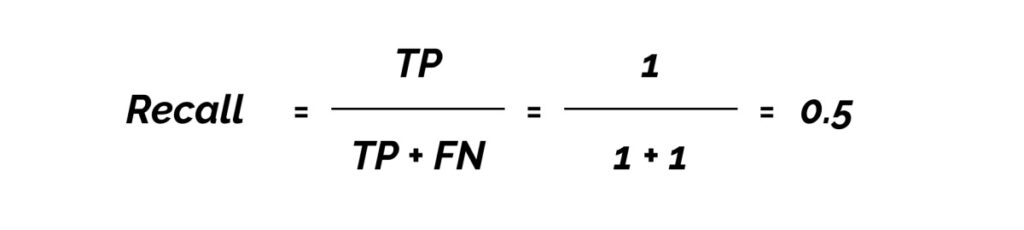
Another important term to understand is ‘recall’.
Recall measures how well you find all the positives. For example, we can find 80% of the possible positive cases in our top K predictions.

TP = true positives (predicted as positive and found to be correct)
FN = false negatives (failed to predict an object that was there)
The general definition for the average precision (AP) is finding the area under the precision-recall curve above.
MAP (mean average precision) is the average of AP.
The Difference Between AP and MAP
In some contexts, AP is calculated for each class and averaged to get the MAP. But in others, they mean the same thing. For example, for COCO challenge evaluation, there is no difference between AP and MAP.
AP is averaged over all categories. Traditionally, this is called “mean average precision” (MAP). We make no distinction between AP and MAP (and likewise AR and MAR) and assume the difference is clear from context. – COCO Evaluation
The mean average precision or MAP score is calculated by taking the mean AP over all classes and/or overall IoU thresholds, depending on different detection challenges that exist.
For example:
In the PASCAL VOC2007 challenge, AP for one object class is calculated for an IoU threshold of 0.5. So the MAP is averaged over all object classes.
For the COCO 2017 challenge, the MAP is averaged over all object categories and 10 IoU thresholds.
So for the above ADAS image, let’s calculate the MAP using the actual formula: Here we assume that the confidence score threshold is 0.5 and the IoU threshold is also 0.5.
So we calculate the AP at an IoU threshold of o.5.
Calculating the AP Using an IoU Threshold
For simplicity, we will calculate an average for the 11-point interpolated AP. In the latest research, more advanced techniques have been introduced to calculate the AP.
True Positives (TP) = 1
Fasle Positives (FP) = 0
False Negatives (FN) = 1
We then plot the 11 points interpolated precision-recall curve.
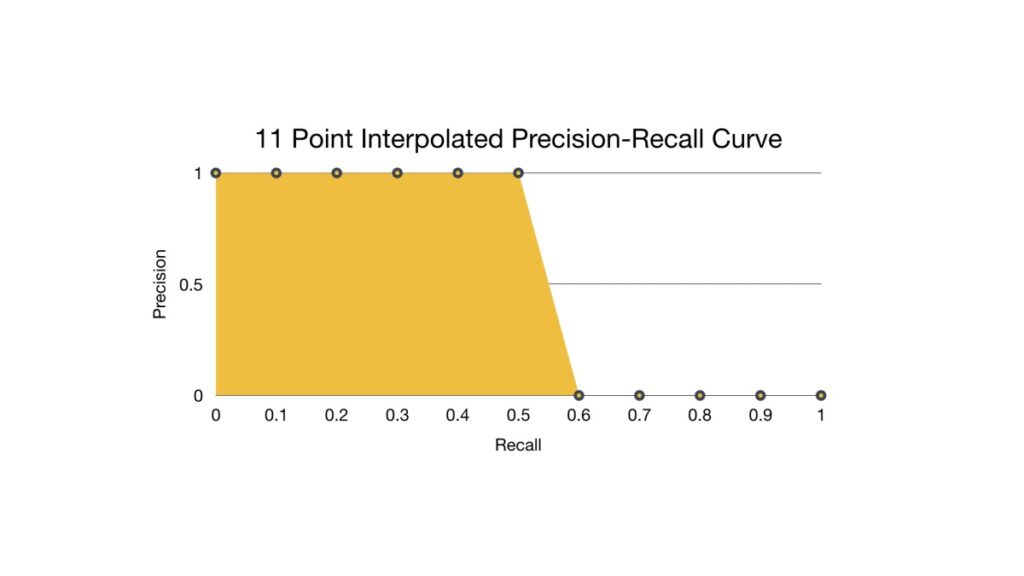
We now calculate the AP by taking the area under the PR curve. This is done by segmenting the recalls evenly into 11 parts: {0,0.1,0.2,…,0.9,1}.

So mAP@0.5 for the image is 0.545, not 1.
Hope this clarifies any misunderstandings of MAP.
Check out this post for more details on creating a robust object detection model.
About the Author